Power outages by state from 2014 to 2024, using EIA data. Updated October 2026.
The average American lost about 6 hours of power a year between 2014 and 2024. That number hides a huge spread. A customer in Louisiana averaged 21.8 hours a year without power, while someone in Arizona averaged 1.6. That’s almost 14 times as long in the dark.
We ranked all 50 states and Washington, DC using 11 years of reliability data from the U.S. Energy Information Administration (EIA). Pick your state below to see where it lands and how much backup light is worth keeping at home.
- 21.8 hrsLouisiana’s yearly average, the highest in the country
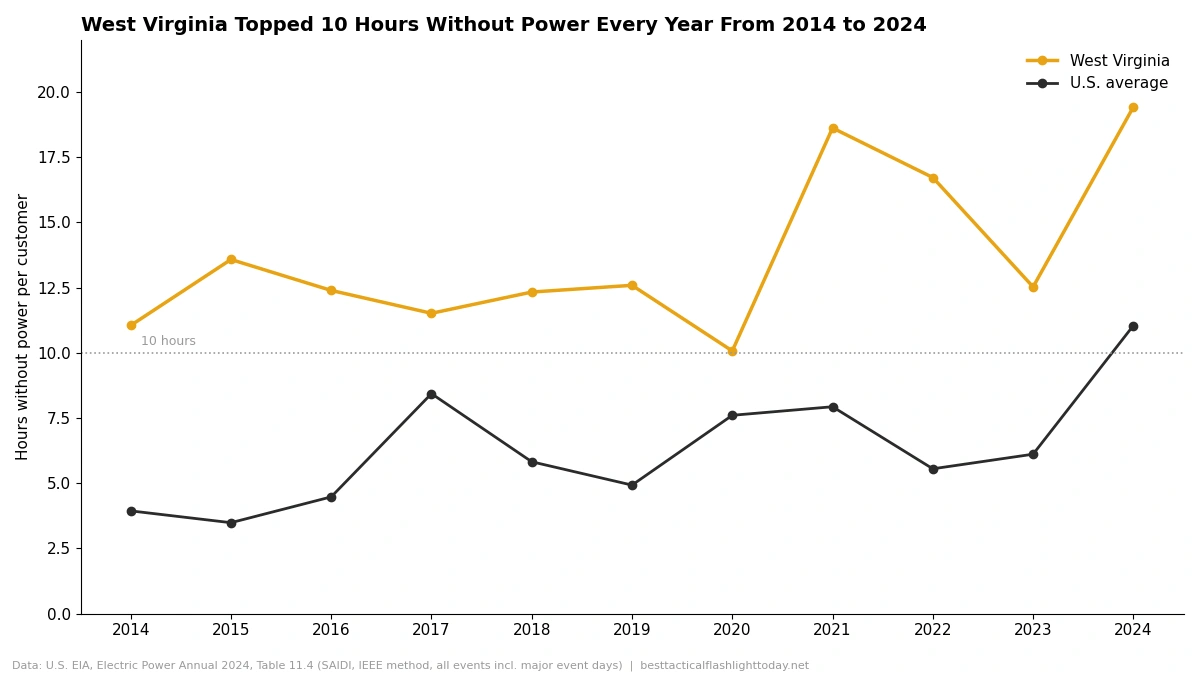
- 11 of 11Years West Virginia topped 10 hours without power
- 11.0 hrsU.S. average in 2024, the worst year of the 11
- 1.6 hrsArizona’s yearly average, the lowest of any state
Look up your state
Choose a state to see its rank, how it compares with the U.S. average, and a simple light plan.
United States
National average
How the light plan works: 9 or more hours a year means 5 nights, 4 to 9 hours means 3 nights, and under 4 hours means 2 nights. One night counts as 12 hours of darkness. Real outages can run longer than any average, so treat the plan as a minimum.
All 51 ranked
Ranked by the average hours each customer went without power per year, 2014 to 2024. Washington, DC is included, which is why the list runs to 51.
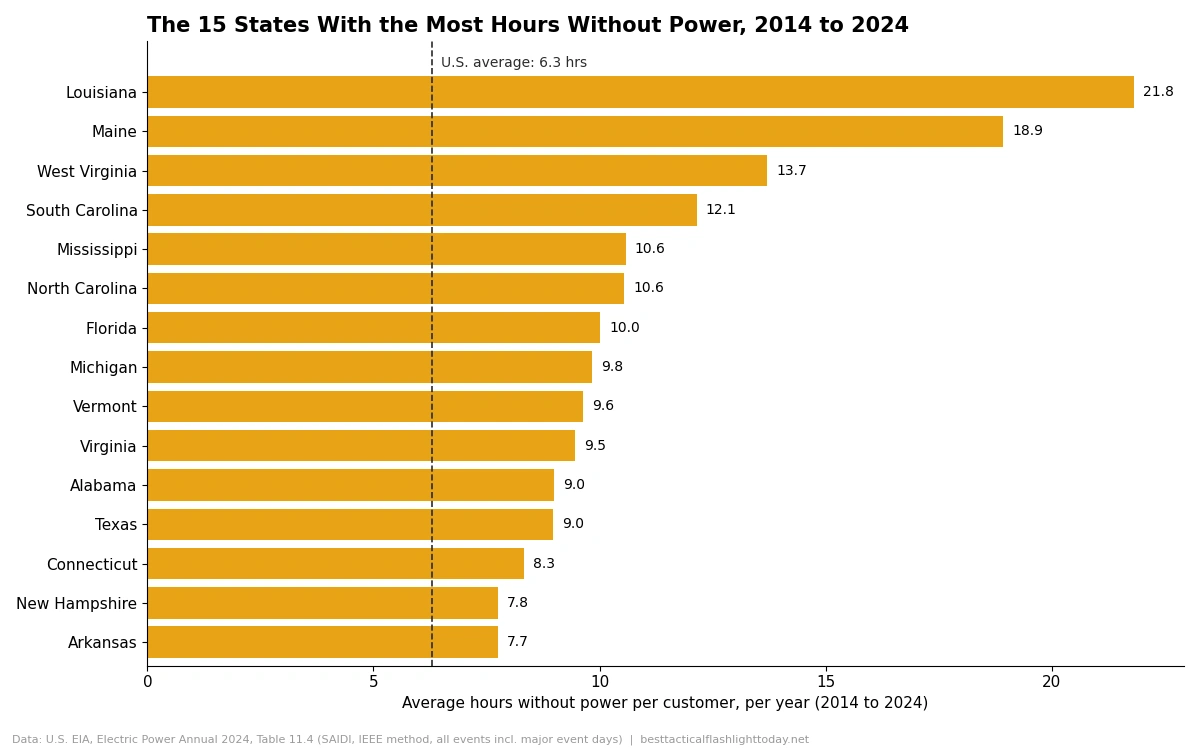
- 1Louisiana5 nights21.8 hrs
- 2Maine5 nights18.9 hrs
- 3West Virginia5 nights13.7 hrs
- 4South Carolina5 nights12.1 hrs
- 5Mississippi5 nights10.6 hrs
- 6North Carolina5 nights10.6 hrs
- 7Florida5 nights10.0 hrs
- 8Michigan5 nights9.8 hrs
- 9Vermont5 nights9.6 hrs
- 10Virginia5 nights9.5 hrs
- 11Alabama5 nights9.0 hrs
- 12Texas5 nights9.0 hrs
- 13Connecticut3 nights8.3 hrs
- 14New Hampshire3 nights7.8 hrs
- 15Arkansas3 nights7.7 hrs
- 16Georgia3 nights7.2 hrs
- 17Alaska3 nights6.7 hrs
- 18Tennessee3 nights6.7 hrs
- 19Oregon3 nights6.5 hrs
- 20Kentucky3 nights6.4 hrs
- 21Washington3 nights6.4 hrs
- 22Oklahoma3 nights6.1 hrs
- 23Rhode Island3 nights5.2 hrs
- 24New York3 nights5.0 hrs
- 25Indiana3 nights4.8 hrs
- 26Pennsylvania3 nights4.8 hrs
- 27Ohio3 nights4.7 hrs
- 28Massachusetts3 nights4.4 hrs
- 29California3 nights4.3 hrs
- 30New Jersey3 nights4.3 hrs
- 31Kansas3 nights4.0 hrs
- 32Wisconsin2 nights3.7 hrs
- 33Idaho2 nights3.6 hrs
- 34Missouri2 nights3.6 hrs
- 35Iowa2 nights3.5 hrs
- 36Montana2 nights3.5 hrs
- 37Hawaii2 nights3.4 hrs
- 38Nebraska2 nights3.3 hrs
- 39Utah2 nights3.1 hrs
- 40North Dakota2 nights3.0 hrs
- 41Wyoming2 nights2.9 hrs
- 42Minnesota2 nights2.8 hrs
- 43Maryland2 nights2.8 hrs
- 44Illinois2 nights2.7 hrs
- 45South Dakota2 nights2.6 hrs
- 46New Mexico2 nights2.5 hrs
- 47Colorado2 nights2.4 hrs
- 48Delaware2 nights2.3 hrs
- 49Nevada2 nights1.9 hrs
- 50Arizona2 nights1.6 hrs
- 51District of Columbia2 nights1.2 hrs
The states that lose the most power
Twelve states average 9 or more hours without power a year. Seven of them touch the Gulf of Mexico or the Atlantic from North Carolina south, where hurricane season drives the worst years.
The other five are Maine, West Virginia, Michigan, Vermont and Virginia. Maine, West Virginia and Vermont are among the heavily forested states the EIA has flagged for frequent interruptions. When trees come down in storms, they take power lines with them.
West Virginia never gets a good year
West Virginia isn’t first on average, but it’s the most consistent. Its customers lost more than 10 hours of power in every year from 2014 to 2024. No other state managed that even 9 years out of 11. Maine came closest with 8.
West Virginia’s best year was 2020, at 10.1 hours. That’s still higher than the national average in every year except 2024.
The worst single years
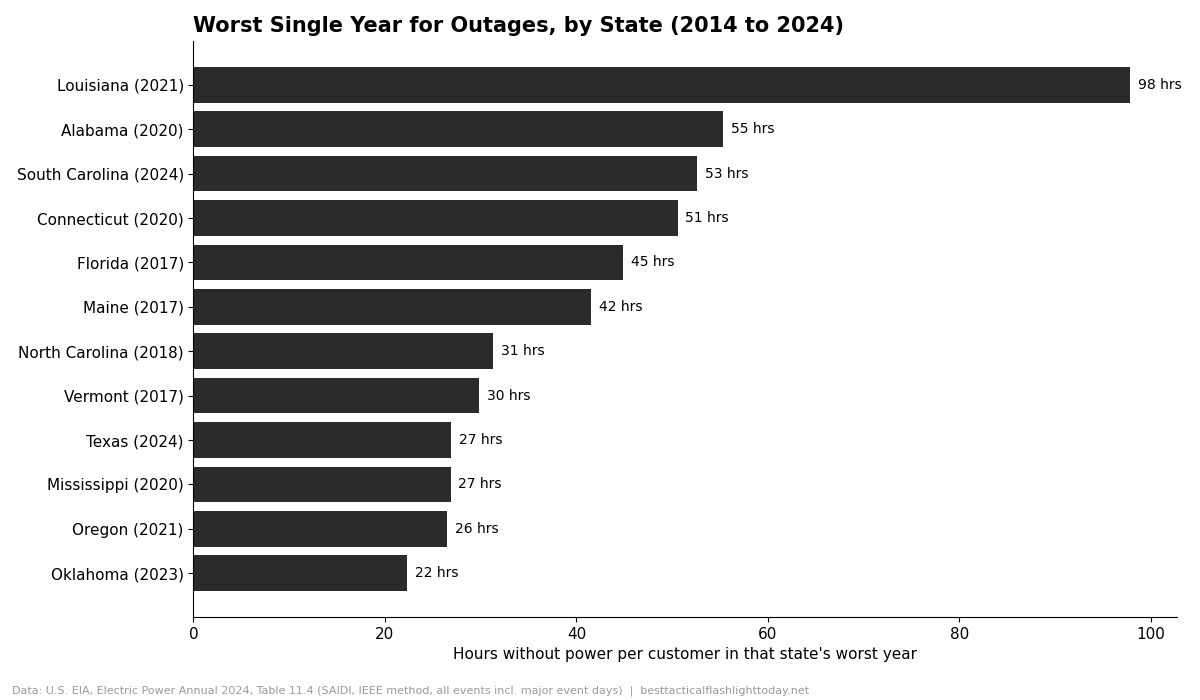
Averages smooth out the bad years. In 2021, the year Hurricane Ida hit, Louisiana customers averaged 97.8 hours without power. That’s about four days. In 2024, South Carolina averaged 52.6 hours after Hurricane Helene tore through the Carolinas, the longest of any state that year according to the EIA.
Even these figures are averages across every customer in the state. People on the hardest hit streets waited far longer.
How much light to plan for
The light plan in the lookup comes from one rule. Find your state’s yearly average, then plan for the nights next to it.
We count a night as 12 hours of darkness, which is about right for an outage in fall or winter.
Sixty hours doesn’t mean one flashlight running nonstop. Most homes do better with a lantern for the main room, a flashlight for each person, and enough batteries or charge to cover the total. Check a light’s runtime on the low or medium mode you’d actually use, not the top mode printed on the box. Our guide to the best flashlights for power outages covers lights with long runtimes on those modes.
What these numbers measure
Every figure comes from the EIA’s Electric Power Annual 2024, Table 11.4. Utilities report a number called SAIDI: the total minutes the average customer went without power in a year. Short blips under five minutes don’t count.
We used the version that includes major events like hurricanes and ice storms, because those are the outages people actually prepare for. We took the figures reported under the industry standard method (IEEE 1366), converted minutes to hours, and averaged each state across 2014 to 2024. Hawaii has 8 years of data instead of 11, so its average covers those years only.
These are statewide averages. A rural home at the end of a long line can lose far more power than its state’s number suggests.
Use this data
You’re welcome to use any chart or number from this page in your own reporting, class or website. Please credit Best Tactical Flashlight Today with a link to this page.
Suggested credit: Best Tactical Flashlight Today analysis of U.S. EIA data, 2014 to 2024, https://besttacticalflashlighttoday.net/power-outages-by-state/
Frequently asked questions
Which state has the most power outages?
By hours without power, Louisiana. Its customers averaged 21.8 hours a year from 2014 to 2024. If you count separate outages instead of hours, Hawaii led in 2024 with 4.4 interruptions per customer, according to the EIA.
Which state has the fewest power outages?
Arizona, at 1.6 hours a year on average. Nevada was next among the states at 1.9. Washington, DC came in lower than both at 1.2 hours.
How many hours a year does the average American go without power?
About 6.3 hours a year from 2014 to 2024. 2024 was the worst year in that stretch at 11 hours, and the EIA credits most of that to Hurricanes Beryl, Helene and Milton.
How long should I prepare to be without power?
Use the light plan above as a starting point: 2, 3 or 5 nights depending on your state. If hurricanes or ice storms hit your area, plan toward the high end even when your state’s average is low. A dependable survival flashlight is a good anchor for that kit.
Building a blackout kit?
See the flashlights we’d keep in a drawer for the next outage.
